Strategy Backtesting
Test your investment strategy on historical data before risking real money. See how your portfolio would have performed in the past.
Test risk-free
Check your strategy on historical data before investing real money.
Benchmark comparison
Compare results against WIG20, S&P 500, MSCI World, and other indices.
Risk metrics
Sharpe ratio, max drawdown, volatility, CAGR - all key metrics in one place.
Configurable rebalancing
Set rebalancing frequency: monthly, quarterly, annually, or on weight deviation.
Data since 2000
Test on over 20 years of historical data for stocks, ETFs, and indices.
AI Agent integration
Ask the AI Agent to propose a strategy and backtest it right away.
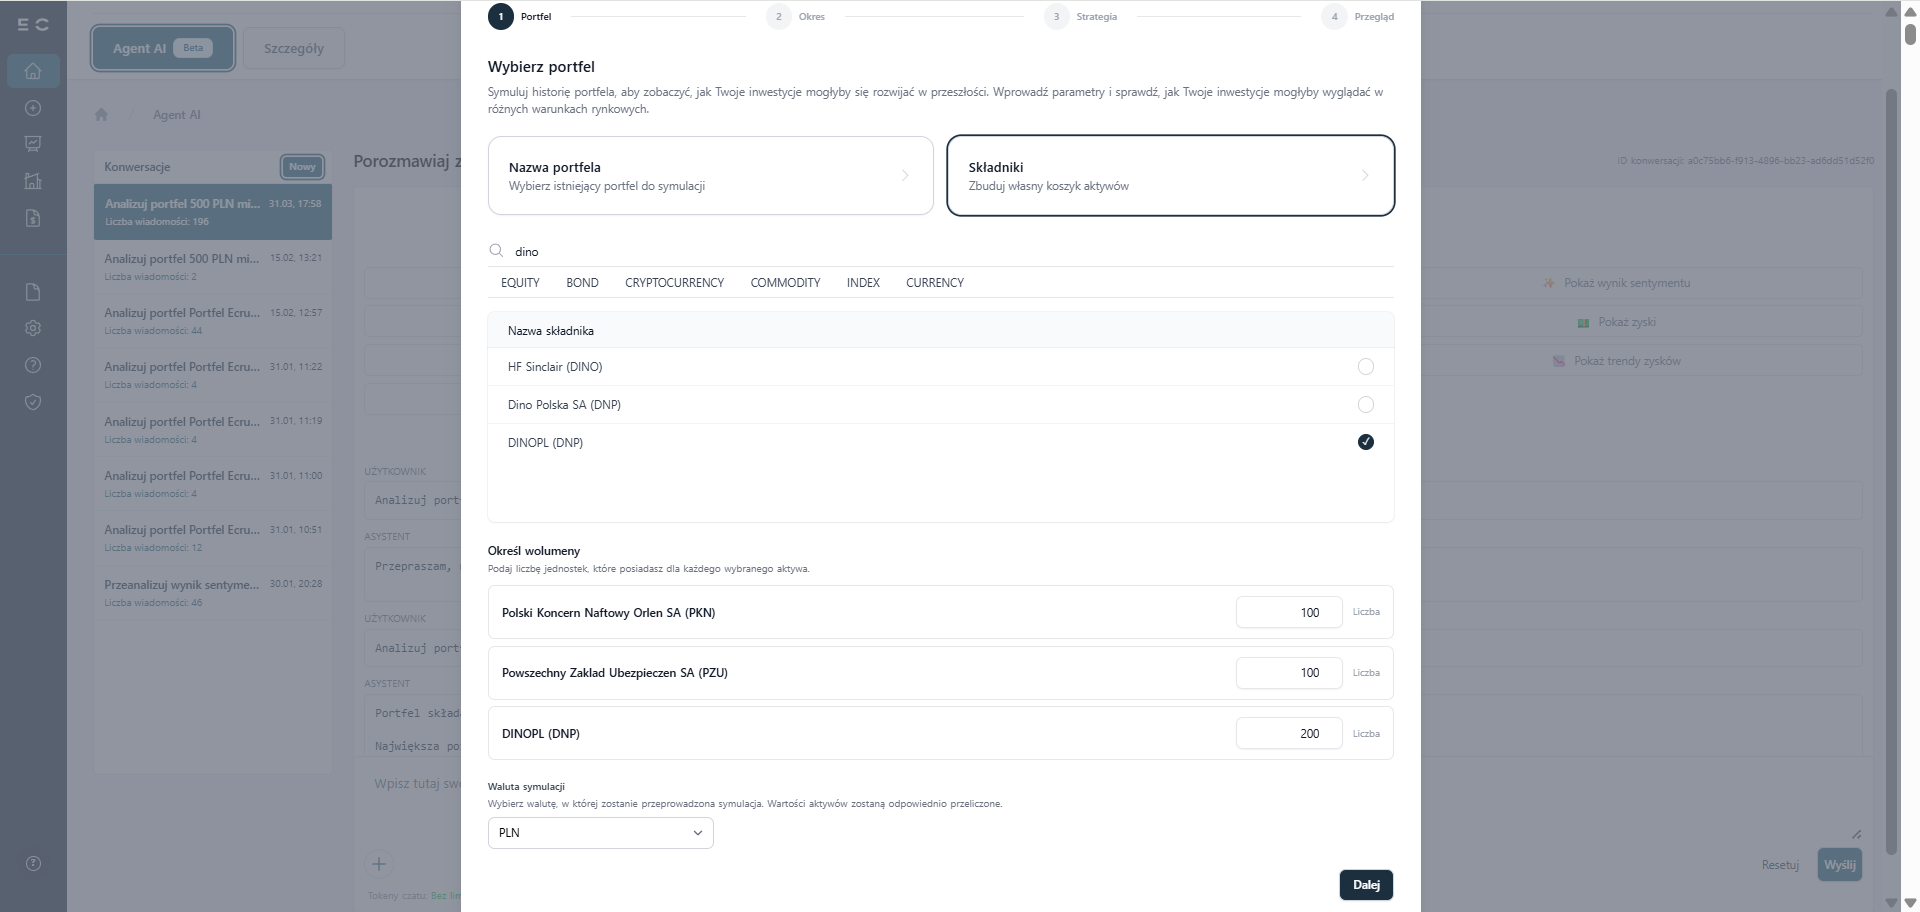
Strategy definition: asset selection, weights, and test period
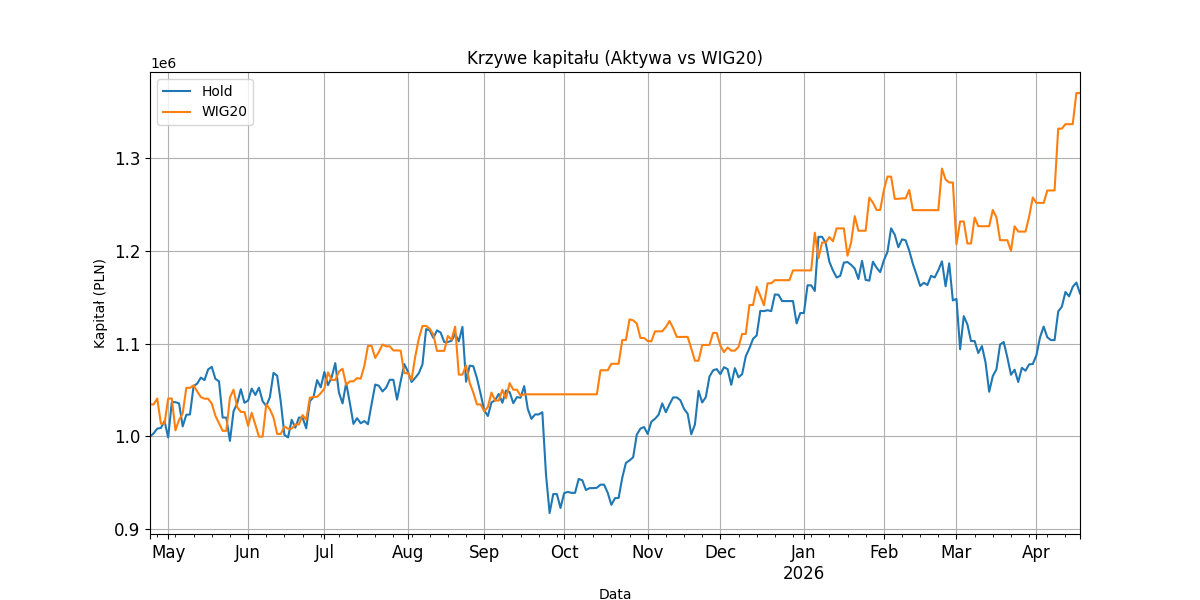
Backtest results chart with benchmark comparison
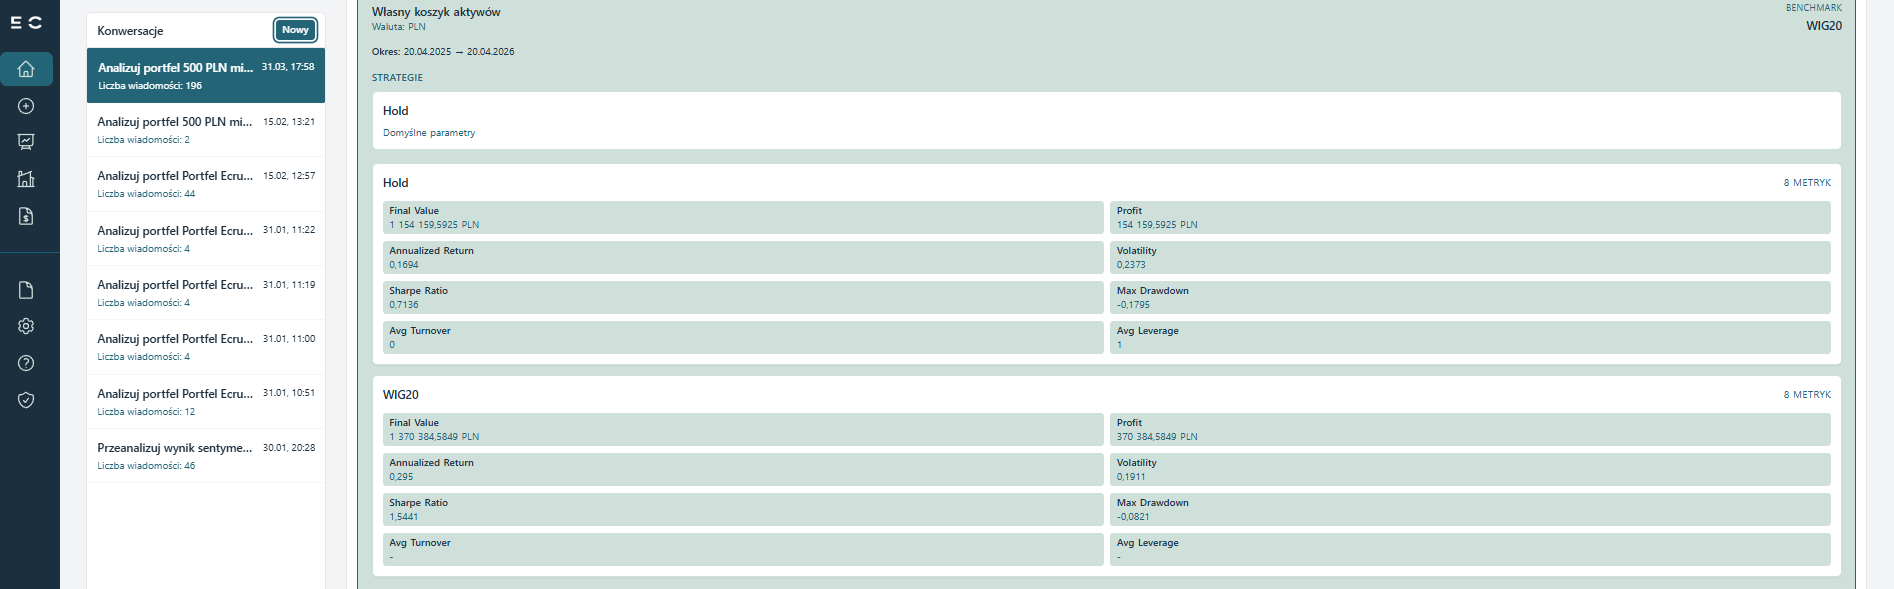
Detailed metrics: Sharpe ratio, drawdown, CAGR, volatility
Test strategies before you invest
Backtesting lets you see how your investment strategy would have performed in the past. Instead of guessing - base your decisions on hard historical data.
How does it work?
Define your portfolio composition, asset weights, and test period. Ecrumena will calculate portfolio results on historical data, accounting for rebalancing, dividends, and transaction costs.
Benchmark comparison
Compare your strategy results against popular benchmarks: WIG20, S&P 500, MSCI World. Check if your strategy actually beats the market.
Risk analysis
Check maximum drawdown, Sharpe ratio, volatility, and other key risk metrics. Understand how much you actually risk in exchange for expected returns.
Frequently asked questions
Pricing
Pricing that grows with you
Choose a subscription plan that fits your needs and get access to the Ecrumena information platform.

How Important Is Control Over Your Investments?
Get Positive Results on the Stock Market
Register to join the world of informed investors. Click below and register today!